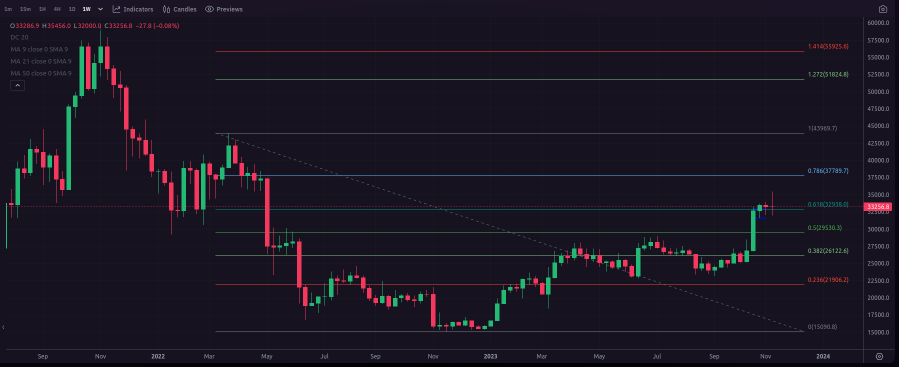
In my recent analysis, titled ‘Bitcoin Bulls Defy Bull Trap! – 1H Chart‘ I delved into Bitcoin’s consistent trading range between €31,600 and €33K following the remarkable October rally. However, in my latest update, zooming out to a weekly perspective, Bitcoin surged beyond the upper boundary, reaching €35K, before retracing to the previous upper channel, which is now acting as solid support around €33K. This long-term view adds a strategic layer to my understanding of Bitcoin’s evolving market dynamics.
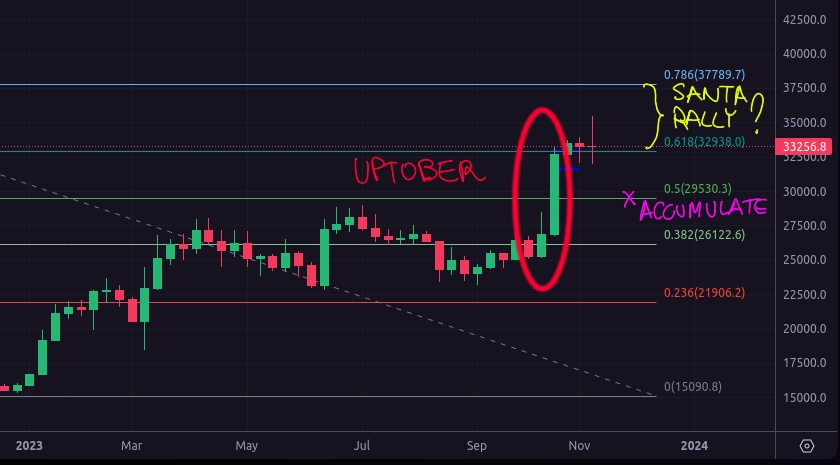
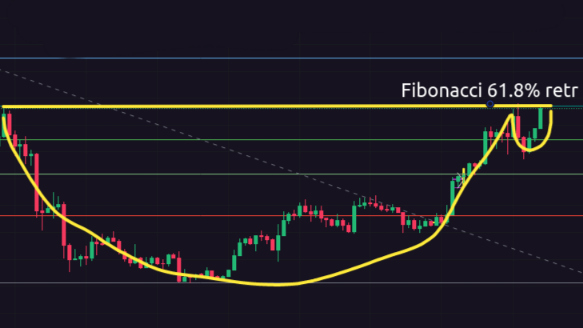
BTCEUR paints a promising weekly picture, showcasing resilience above the 61.8% Fibonacci retracement level. After a stellar #UPTOBER breakout past the €26,000 mark (38.2% Fib), potential momentum eyes the €37,700 (61.8% Fib) resistance.

A bull rally toward 44k, the Fibonacci retracement’s starting point, is in the cards. With an eye on strategic reentry, if a retracement to the 50% level at €29,500 materializes, I’m considering bolstering my position.

Let’s stay tuned to see if the #SantaRally has one more gift for us before year-end! 📈🎁 #BitcoinEUR #FibonacciAnalysis #MarketInsights


