Trading Strategy 101:
In the world of finance, a well-defined trading strategy is essential for making informed investment decisions and achieving profitability. The Turtle Trading Strategy stands out as a tried-and-true approach that has been successfully applied in various financial markets, including the rapidly growing realm of cryptocurrency. In this article, we will delve into the history of the Turtle Trading Strategy, explore its core principles, and discuss how it can be leveraged in Bitcoin trading.
Origins of the Turtle Trading Strategy
The genesis of the Turtle Trading Strategy dates back to the 1980s, when two renowned commodity traders, Richard Dennis and William Eckhardt, embarked on an intriguing experiment. Convinced that trading success was not solely dependent on natural aptitude, they sought to prove that anyone could be trained to become a successful trader. Their mission was to transform ordinary individuals into skilled traders, much like teaching a turtle to navigate through the financial landscape. And so, the “Turtles” were born.
Under the tutelage of Dennis and Eckhardt, the Turtles learned a set of rigid rules and techniques designed to help them identify and capitalize on market trends. By following these guidelines, the novice traders were able to achieve remarkable results, defying the common belief that only seasoned veterans could succeed in the cutthroat world of trading.
Evolution of the Turtle Trading Strategy
Fast forward to the present day, and the Turtle Trading Strategy continues to thrive, adapting to new markets and asset classes. One such domain where the Turtle Strategy has found great success is in Bitcoin trading. With its emphasis on identifying and following trends, the Turtle methodology aligns perfectly with the volatile and unpredictable nature of cryptocurrency markets.
At its core, the Turtle Trading Strategy revolves around several key tenets
Emphasis on Trend Following: The Turtle Strategy places significant importance on recognizing and following market trends. This approach involves identifying patterns in price movements and utilizing indicators to determine entry and exit points.
Risk Management: A crucial aspect of the Turtle Strategy is managing risk through the use of stop-loss orders and position sizing. By limiting potential losses and maximizing gains, traders can minimize their exposure while still capitalizing on lucrative opportunities.
Objectivity: The Turtle Strategy encourages traders to remain objective, avoiding emotional decision-making and relying on predefined rules to guide their actions. This helps eliminate impulsive choices fueled by fear, greed, or other psychological factors.
Flexibility: Another hallmark of the Turtle Trading Strategy is its flexibility. As market conditions change, traders must adapt their approaches to maintain alignment with the prevailing trends. This may involve shifting from long positions to short positions or adjusting indicator settings to reflect changing market dynamics.
Discipline: Successful implementation of the Turtle Strategy requires discipline and adherence to the established rules. Traders must resist the temptation to deviate from the plan, even during periods of heightened volatility or unexpected market fluctuations.
The original turtle trading rules developed by Richard Dennis include:
Volatility-based position sizing methods: The turtles used the average true range (ATR) indicator to calculate volatility and adjusted their position sizes accordingly. They took larger positions in less volatile markets and reduced their exposure in highly volatile markets to maintain equivalent risk per dollar.
Pyramiding: The turtles added to their winning positions, using their increasing profits to carry additional positions. They kept their risk-to-reward ratio low, ensuring they never risked more than half of what they stood to gain. They only employed pyramiding when the market was trending strongly and had an exit strategy in place.
Turtle trading exits and stops: The turtles used stop-loss orders to limit their losses. They exited a losing trade when the market reached its predetermined stop price. For winning trades, they exited when a breakout occurred in the opposite direction of their position, following specific criteria to minimize losses and lock in profits.
These rules formed the foundation of the turtle trading strategy, a trend-following approach that aimed to capture significant price movements while managing risk through disciplined entry and exit strategies.
Here’s a brief overview of how it works and how to read buy and sell signals based on the indicators used:
The Donchian Channel is a popular technical analysis tool used by traders to identify potential trading opportunities in financial markets. Developed by Richard Donchain, the indicator consists of three lines generated by moving average calculations that surround a median band. The upper band represents the highest price of a security over a specified number of periods, while the lower band represents the lowest price. A breakout above the upper band or below the lower band can signal a potential trading opportunity.
The Turtle Trading Rules are a well-known strategy based on the Donchian Channel. This strategy involves entering long positions when the price breaks out above the upper band and entering short positions when the price breaks down below the lower band. However, it’s important to note that this strategy alone is not enough to guarantee successful trades. Traders should combine the Donchian Channel with other technical indicators and risk management techniques to increase their chances of success.
Here are some tips for using the Donchian Channel effectively:
Choose the right time frame: Select a time frame that aligns with your trading goals and risk tolerance. A shorter time frame can result in more frequent trading opportunities, but it may also increase the risk of false signals.
Set appropriate stop-losses: Use stop-loss orders to limit potential losses. Place stop-losses beyond the recent swing high or low to avoid being stopped out by normal price fluctuations.
Manage risk: Use position sizing and risk management strategies to manage your exposure to the market. Never bet more than you can afford to lose.
Combine with other indicators: Use other technical indicators, such as momentum indicators or volume indicators, to confirm trading opportunities.
Stay disciplined: Follow your trading plan and avoid emotional decisions. Stay focused on your long-term goals and avoid getting distracted by short-term market fluctuations
Applying the Turtle Trading Strategy in Bitcoin Markets:
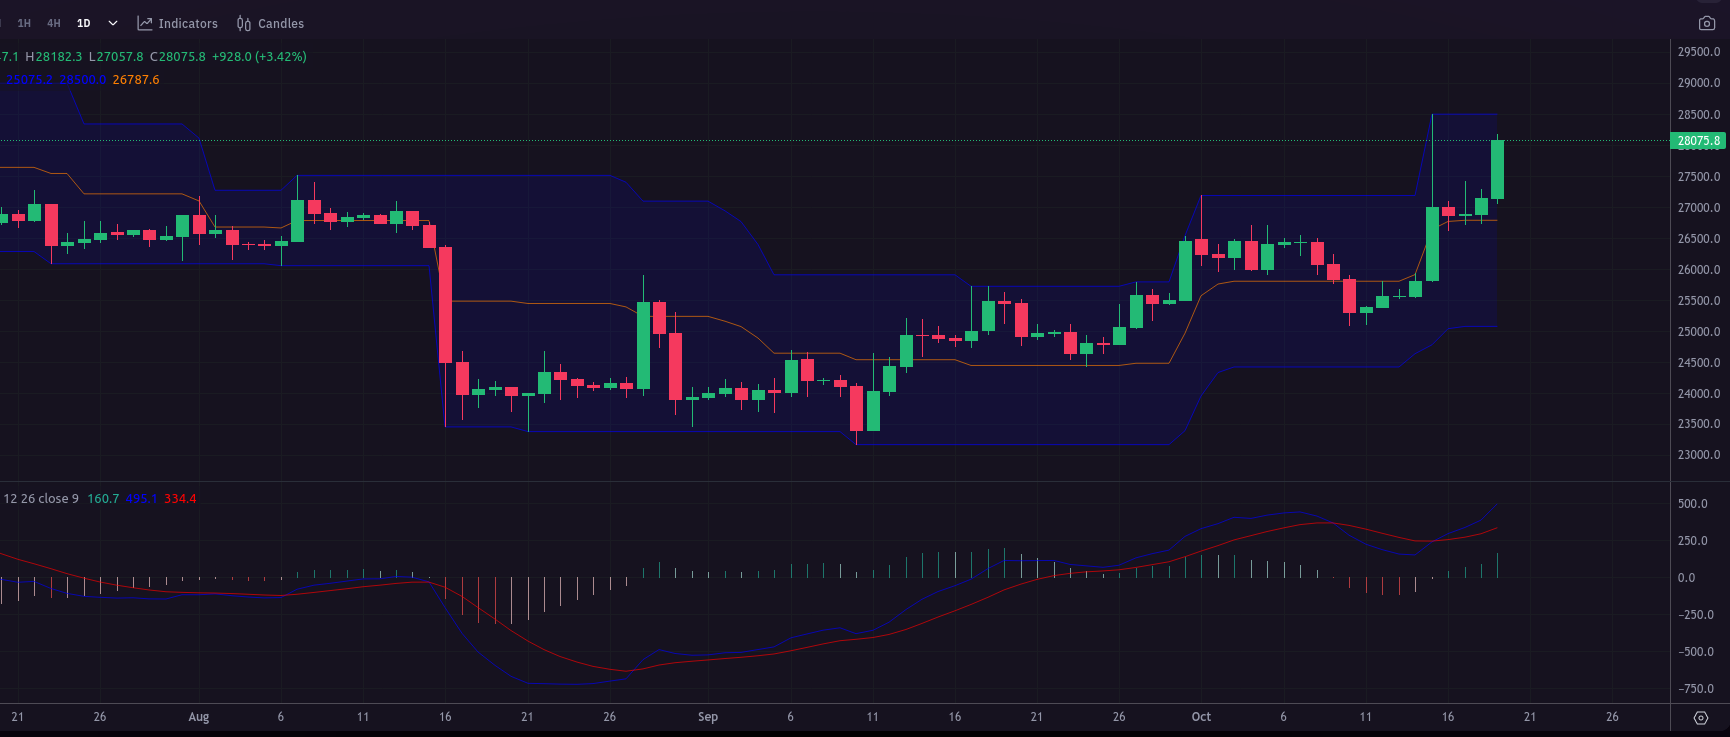
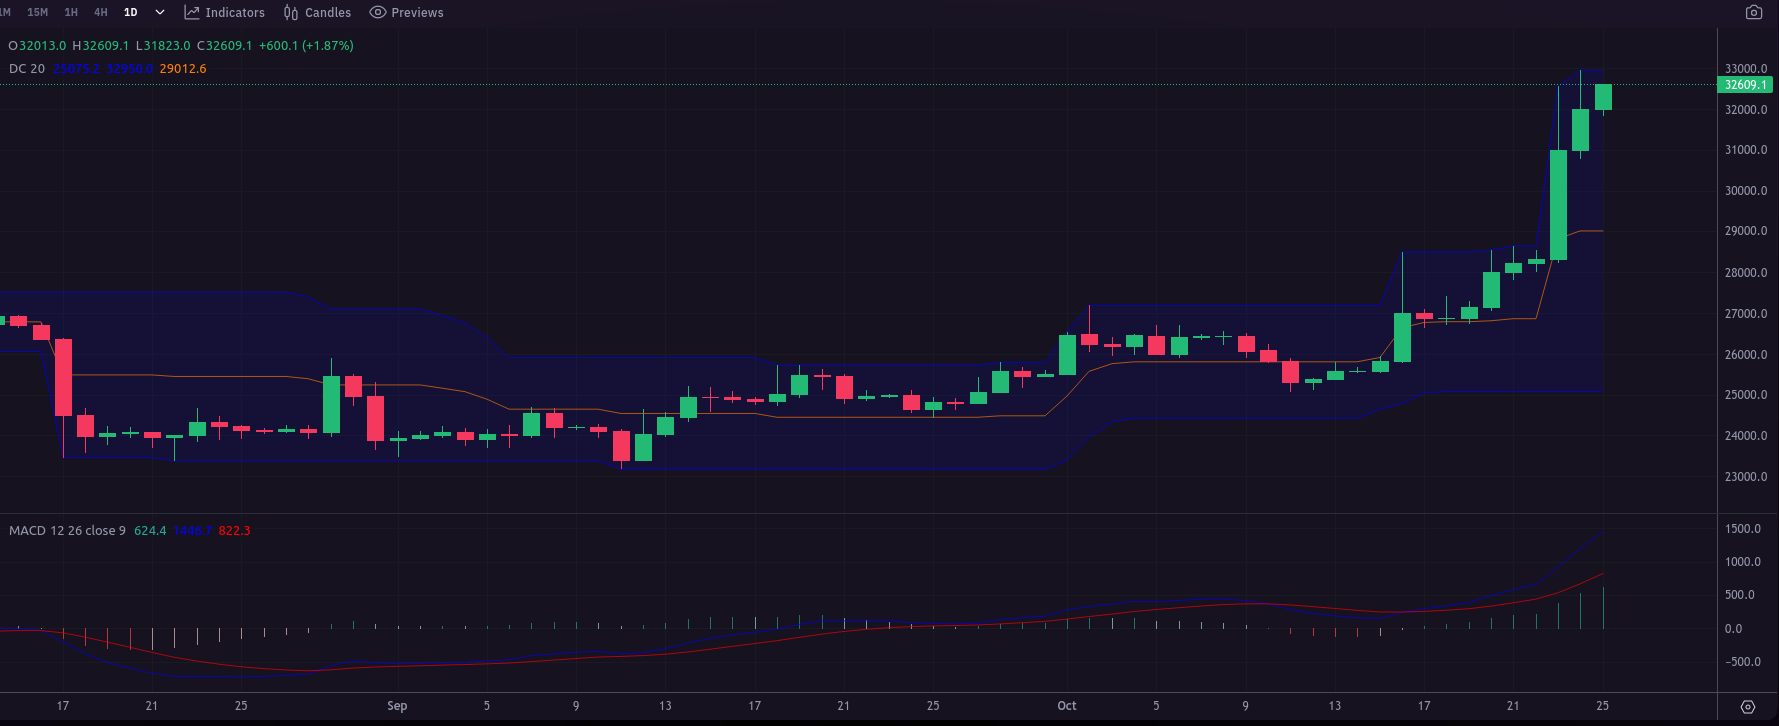
As shown in the attached charts, we witnessed a classic Turtle Strategy setup. When Bitcoin broke above the highest high observed during a look-back period, it confirmed a bullish trend. This is the essence of the Turtle Trading Strategy.
In the first chart, we observe the initial breakout at a price level of 25500€. The Turtle Strategy recommends entering long trades when such breakouts occur. The MACD line must cross above the signal line. Signal Line (9-period EMA): This indicator is used in conjunction with the MACD to generate buy and sell signals. When the MACD line crosses above the signal line, it generates a buy signal, while crossing below the signal line generates a sell signal.
Fast forward to the latest chart, where Bitcoin has surged to a new relative high at 33K Euro, as predicted by the strategy. Traders who followed the trend were likely able to ride the wave, capitalizing on significant gains.
The Turtle Trading Strategy is a testament to the power of disciplined, trend-following approaches in the ever-evolving world of cryptocurrencies. By adhering to its principles, investors can navigate the turbulent waters of Bitcoin with a higher probability of success.
The Turtle Trading Strategy is in full swing. Stay tuned for updates as we continue to ride the crypto wave with this powerful trend-following approach.

 #CryptoTrading #TurtleStrategy #BitcoinTrading

Unlocking the Power of the Turtle Trading System in Bitcoin Markets


